Super-powered notebooks with Python and Quarto
thomasmock.quarto.pub/python-austin
What is Quarto?
Quarto is an open-source scientific and technical publishing system that builds on standard markdown with features essential for scientific communication.
- Computations: Python, R, Julia, Observable JS
- Markdown: Pandoc flavored markdown with many enhancements
- Output: Documents, presentations, websites, books, blogs
Literate programming system in the tradition of Org-Mode, Weave.jl, R Markdown, iPyPublish, Jupyter Book, etc.
Origins
- Open Source project sponsored by Posit, PBC (formerly known as RStudio, PBC)
- 10+ years of experience with R Markdown, a similar system that was R-specific, convinced us that the core ideas were sound
- The number of languages and runtimes used for scientific discourse is broad
- Quarto is a ground-up re-imagining of R Markdown that is fundamentally multi-language and multi-engine
- Quarto gets inspiration from both R Markdown and Jupyter, and provides a plain-text option or the use of native Jupyter notebooks
Goal: Computation document
- Documents that include source code for their production
- Notebook AND plain-text flavors
- Programmatic automation and reproducibility
Goal: Scientific Markdown

Goal: Single Source Publishing

Simple Example
---
title: "matplotlib demo"
format:
  html:
    code-fold: true
jupyter: python3
---

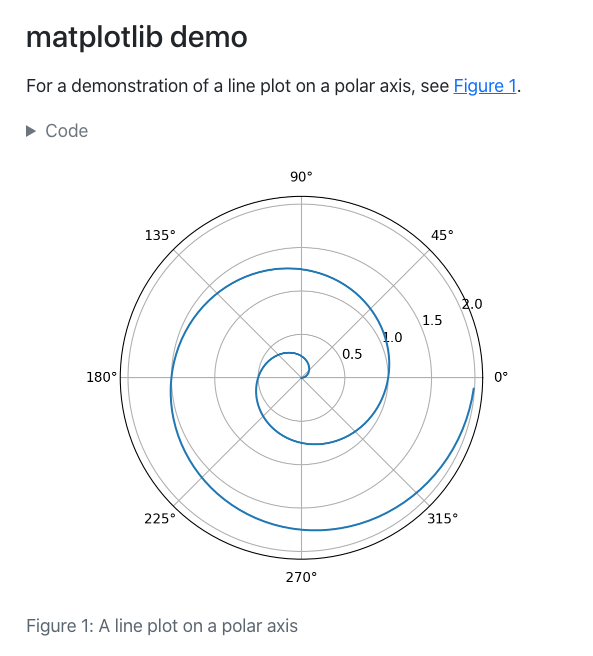
For a demonstration of a line plot on a polar
axis, see @fig-polar.
```{python}
#| label: fig-polar
#| fig-cap: "A line plot on a polar axis"
import numpy as np
import matplotlib.pyplot as plt
r = np.arange(0, 2, 0.01)
theta = 2 * np.pi * r
fig, ax = plt.subplots(
subplot_kw = {'projection': 'polar'}
)
ax.plot(theta, r)
ax.set_rticks([0.5, 1, 1.5, 2])
ax.grid(True)
plt.show()
```
Simple Example, multi-format
Can be rendered to dozens of output formats with Quarto (via Pandoc):
| Feature | Quarto |
|---|---|
| Basic Formats | |
| Beamer | |
| PowerPoint | |
| HTML Slides | |
| Advanced Layout |
| Feature | Quarto |
|---|---|
| Cross References | |
| Websites & Blogs | |
| Books | |
| Interactivity | |
| Dashboards | Quarto Dashboards |
| Journal Articles | Out and more coming! |
So what is Quarto?
Quarto® is an open-source scientific and technical publishing system built on Pandoc.
Basic Workflow
Rendering (execute and write to disk):
IPython
For execution of R, Quarto uses knitr as the engine, but for Python Quarto natively executes Python with Jupyter kernels such as IPython.
- The indicated or default Python Jupyter kernel is bound automatically when
{python}executable cells are present. You can set a specific kernel via the YAML:
IPython executes Python code and transforms it to plain text, graphics, markdown, HTML, etc.
For interactive sessions, Quarto keeps the Jupyter Kernel resident as a daemon to mitigate startup times.
A .qmd is a plain text file
Code
But Quarto doesn’t have to be plain-text

Rendering pipeline
Plain text workflow (.qmd uses Jupyter kernel to execute cells):

Notebook workflow (defaults to using existing stored computation):

What to do with my existing .ipynb?
You can keep using them! You get to choose whether to use the stored computation OR re-execute the document from top to bottom.
Quarto can help convert back and forth between plain text .qmd and .ipynb - kind of like jupytext but specific to Quarto:
quarto convert --help

Usage:   quarto convert <input>
Description:
    Convert documents to alternate representations.

Convert notebook to markdown:                quarto convert doc.ipynb
Convert markdown to notebook:                quarto convert doc.qmd
Convert notebook to markdown, write to file: quarto convert doc.ipynb --output doc.qmd
Stored/frozen computation and reproducibility
- Jupyter natively approaches this as storing the source code, output file, and cache the resulting computation in a single document (
.ipynbwhich is JSON)
- Jupyter Cache provides transient caching of cell outputs for a doc (if any cells in doc change, then all of the cells will be re-executed)
- Quarto’s Freeze feature uses a multi-file approach:
- Source code input (plain text
.qmdand/or.ipynb) - Complete output file (some format like
.htmlor.pdf) - Frozen computation stored separately by directory and file as
.json, allows for permanately saving and re-use of computational outputs across entire project.
Comfort of your own workspace
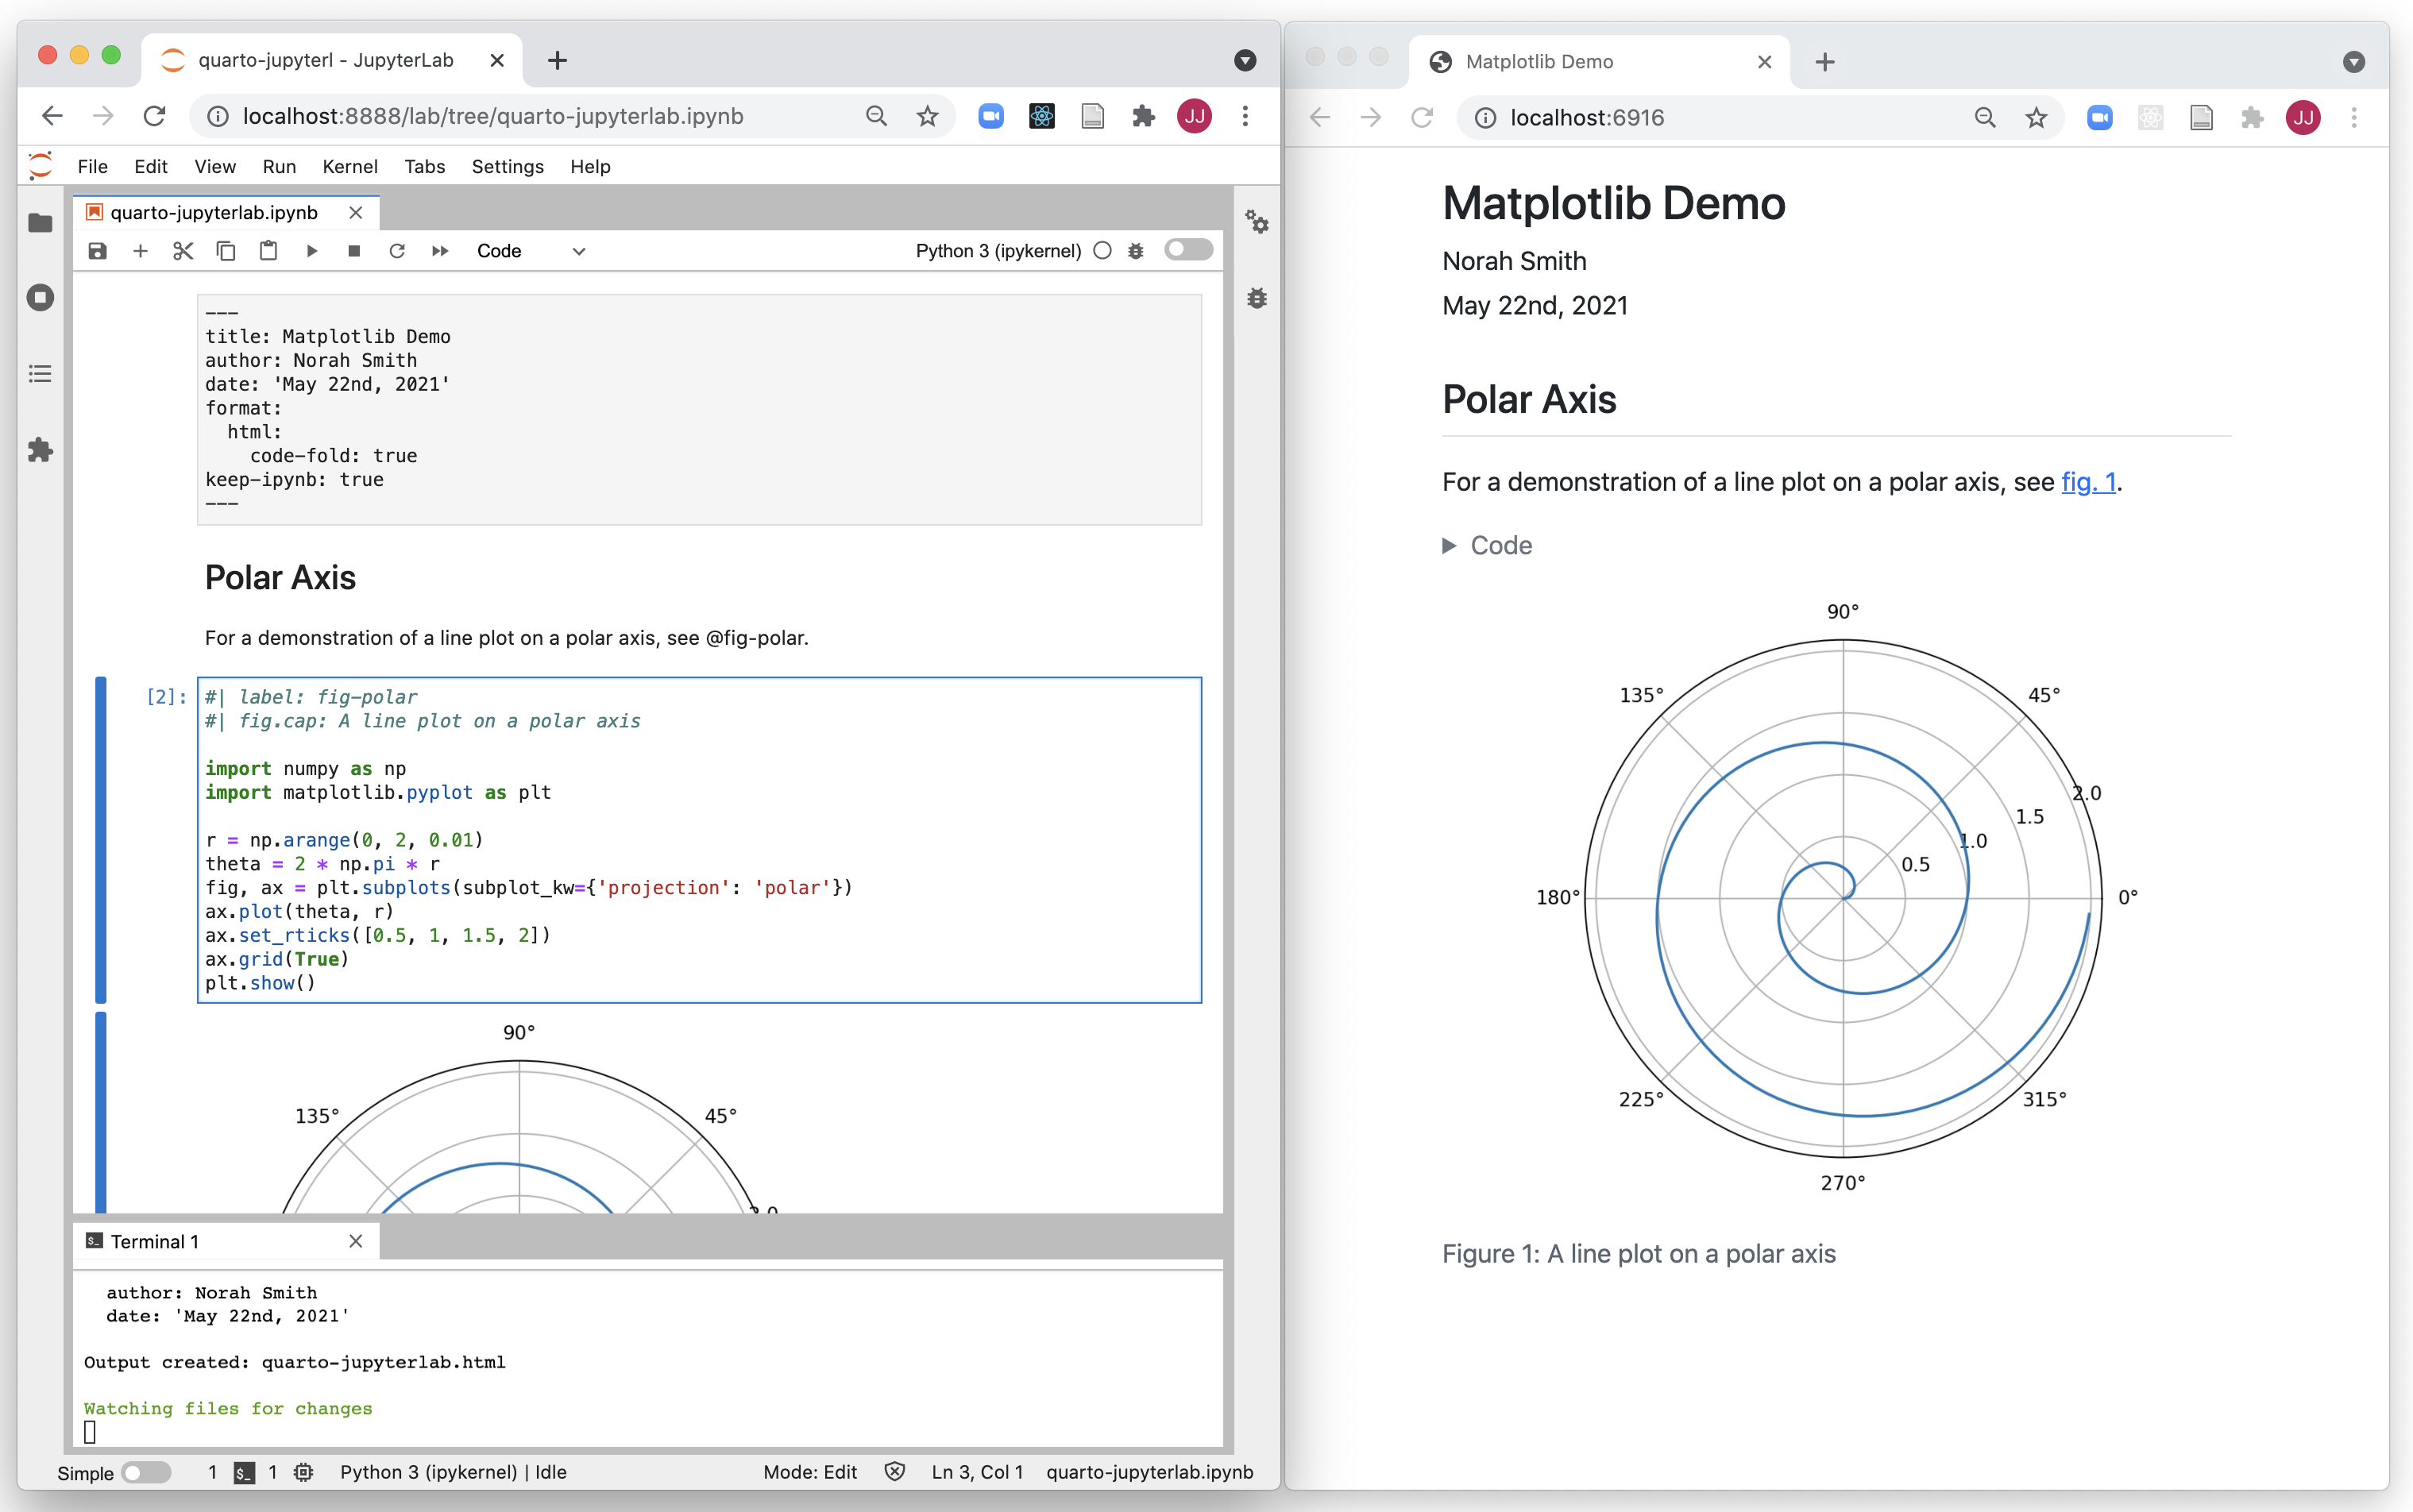
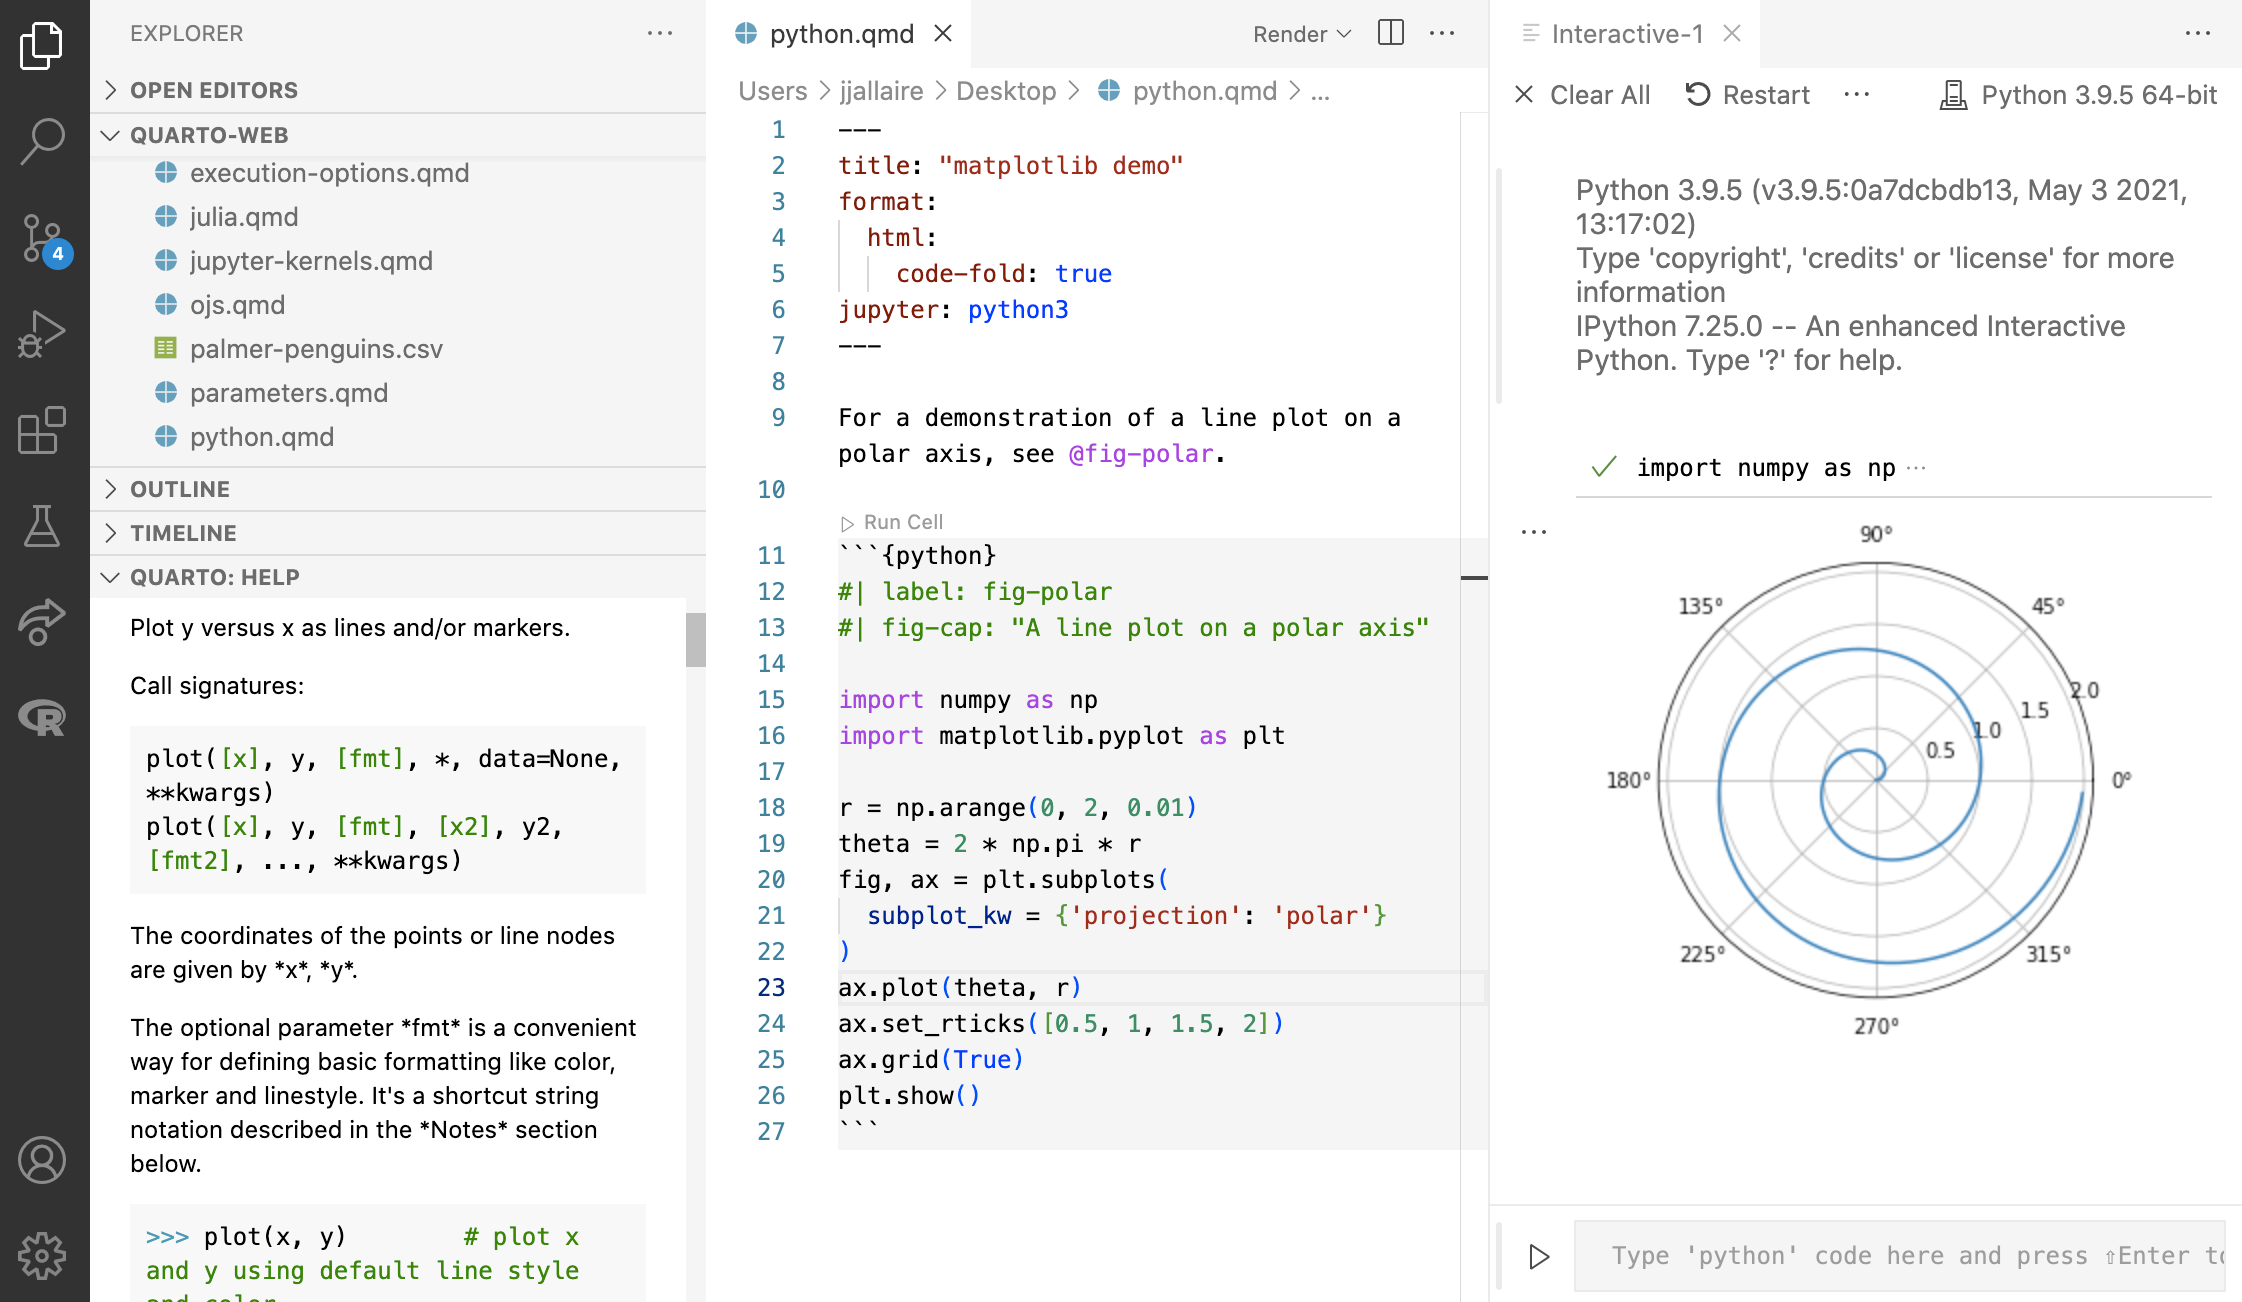
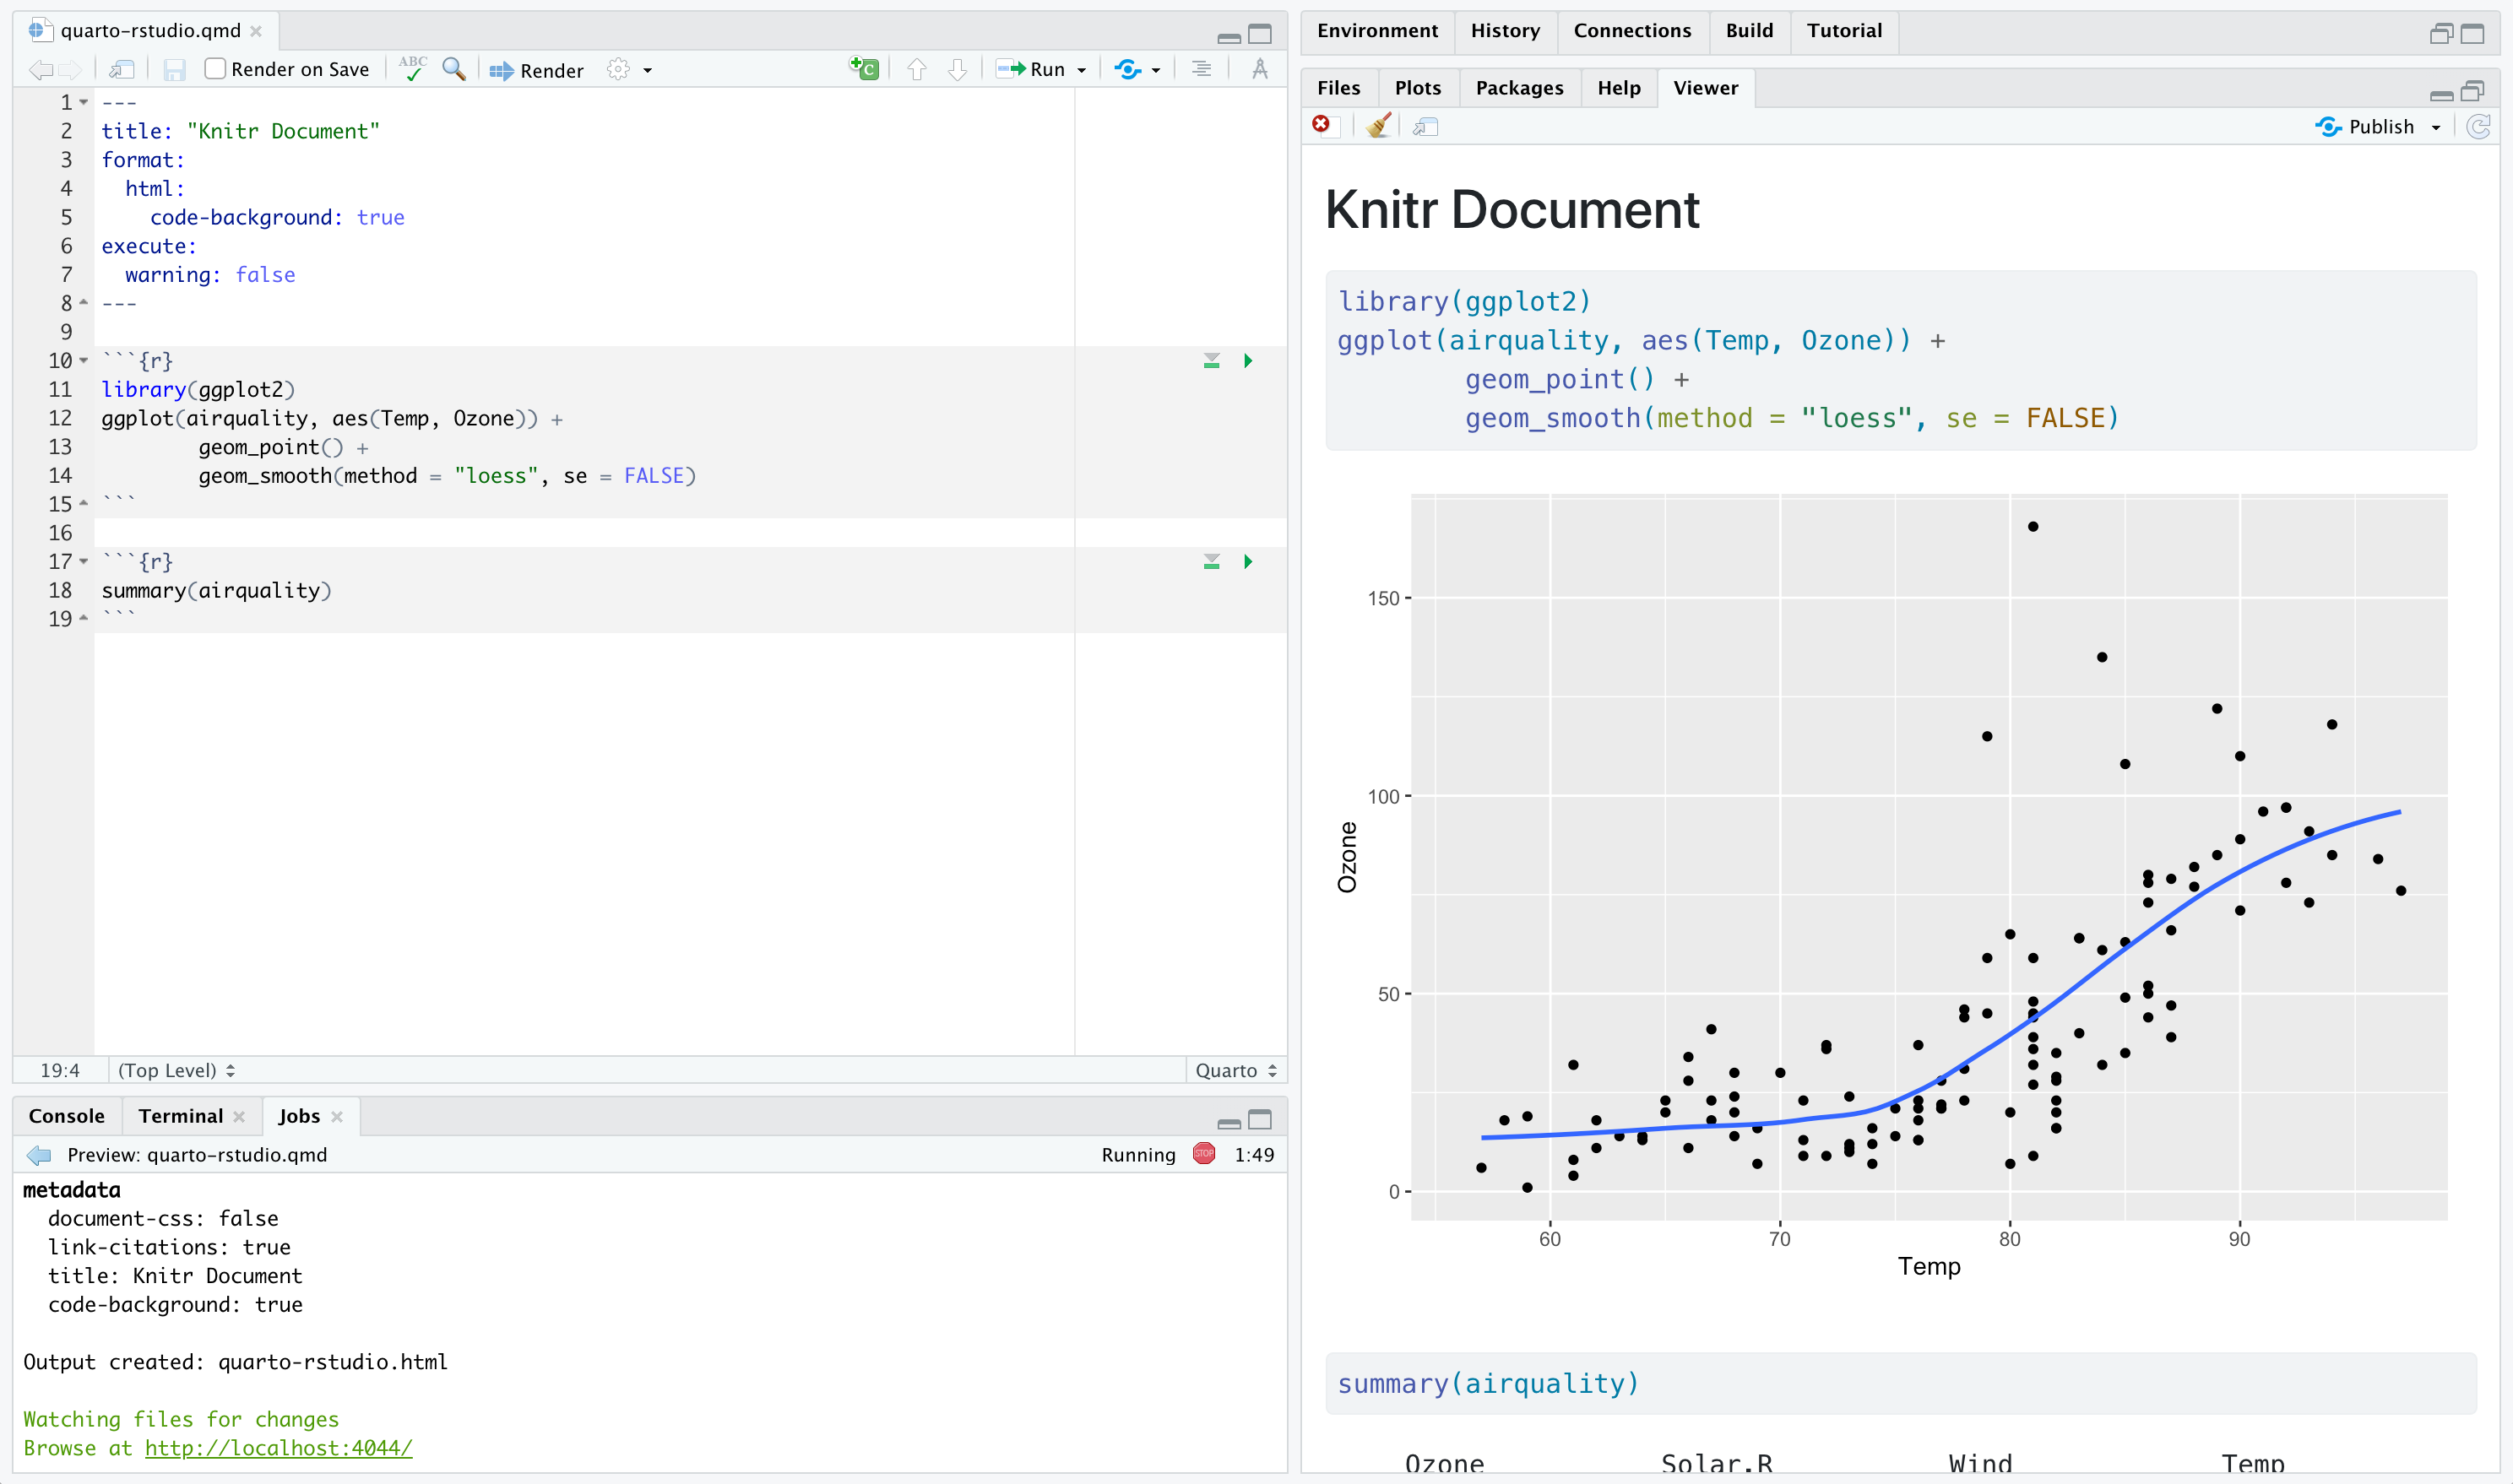
Auto-completion in RStudio + VSCode
Both RStudio and VSCode with the Quarto extension have rich auto-completion
YAML

Chunk option

Quarto Extensions and Visual/Live Editor


Quarto, unified document layout


Quarto, unified syntax across markdown and code
Add two images on disk to a two column layout.
Two plots from code, layout in two columns.
```{python}
#| layout-ncol: 2
#| fig-cap: ["Scatter", "Boxplot"]

from plotnine import ggplot, geom_point, geom_boxplot, aes, stat_smooth, facet_wrap, theme
from plotnine.data import mtcars

# plot 1 in column 1
plot1 = (ggplot(mtcars, aes('wt', 'mpg', color='factor(gear)'))
   + geom_point() + stat_smooth(method='lm')
   + facet_wrap('~gear')).draw(show=True)

# plot 2 in column 2
plot2 = (ggplot(mtcars, aes('cyl', 'mpg', color='factor(cyl)'))
+ geom_boxplot()).draw(show=True)
```

Quarto Manuscripts
Live example at Quarto Manuscripts
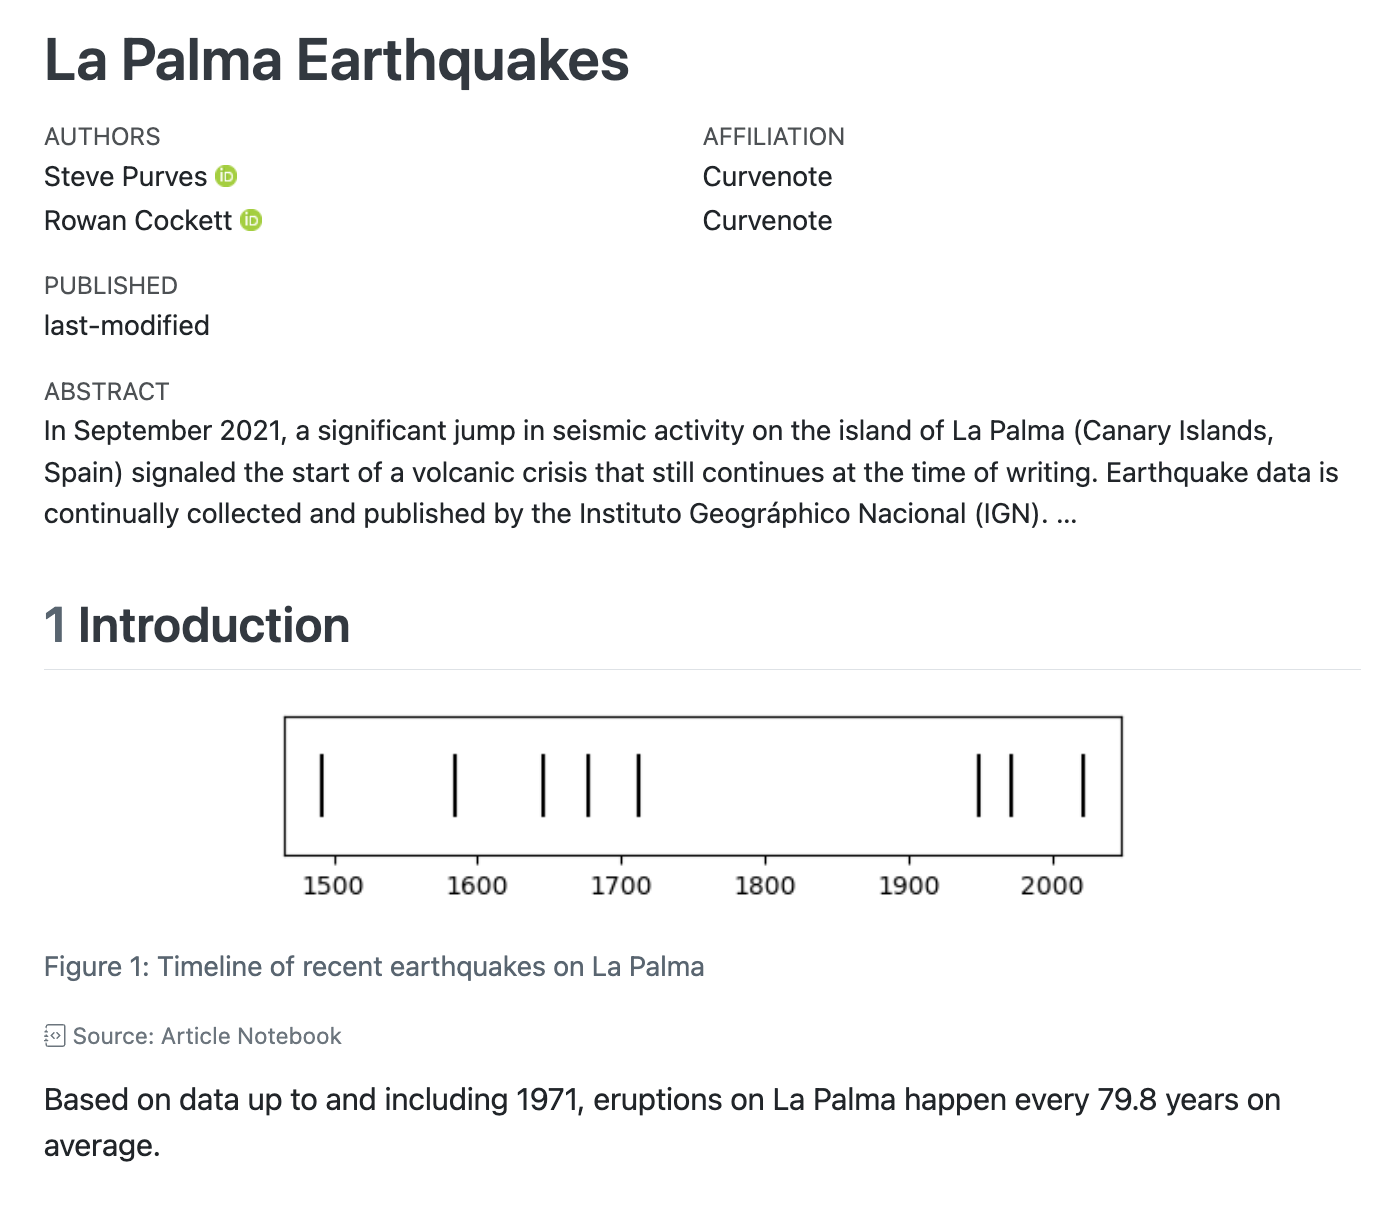
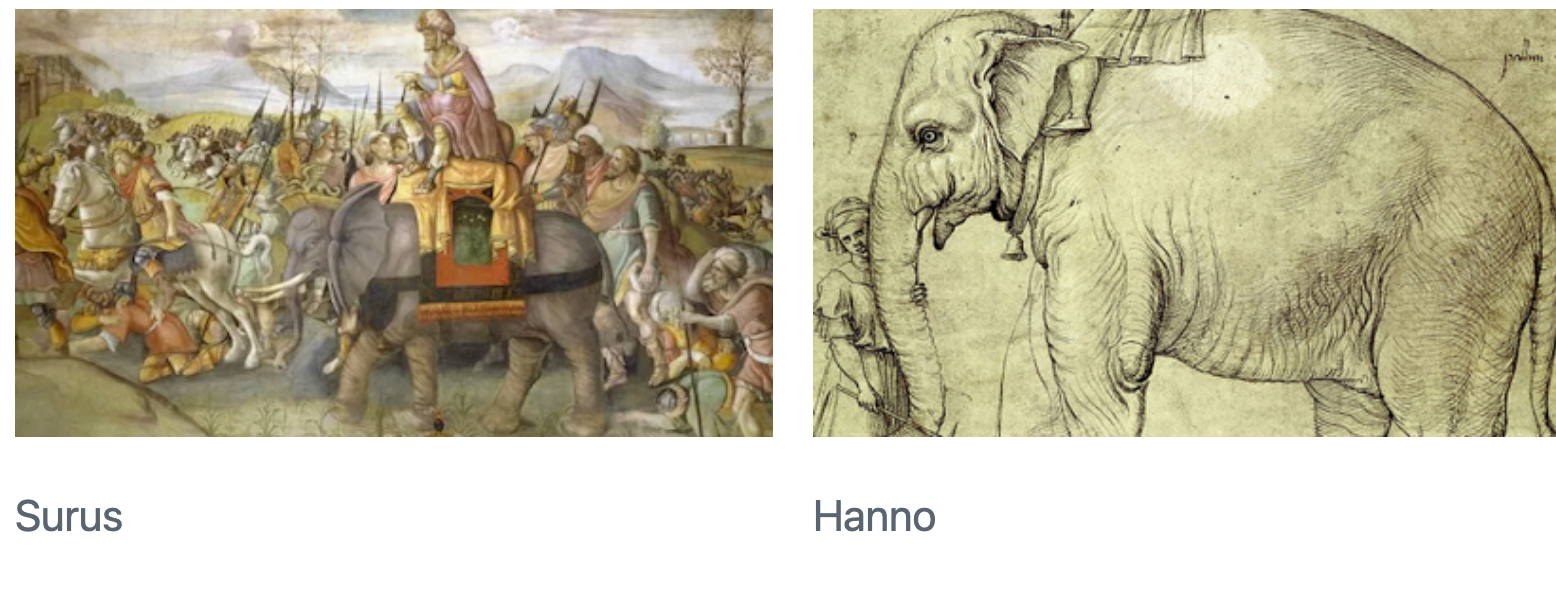
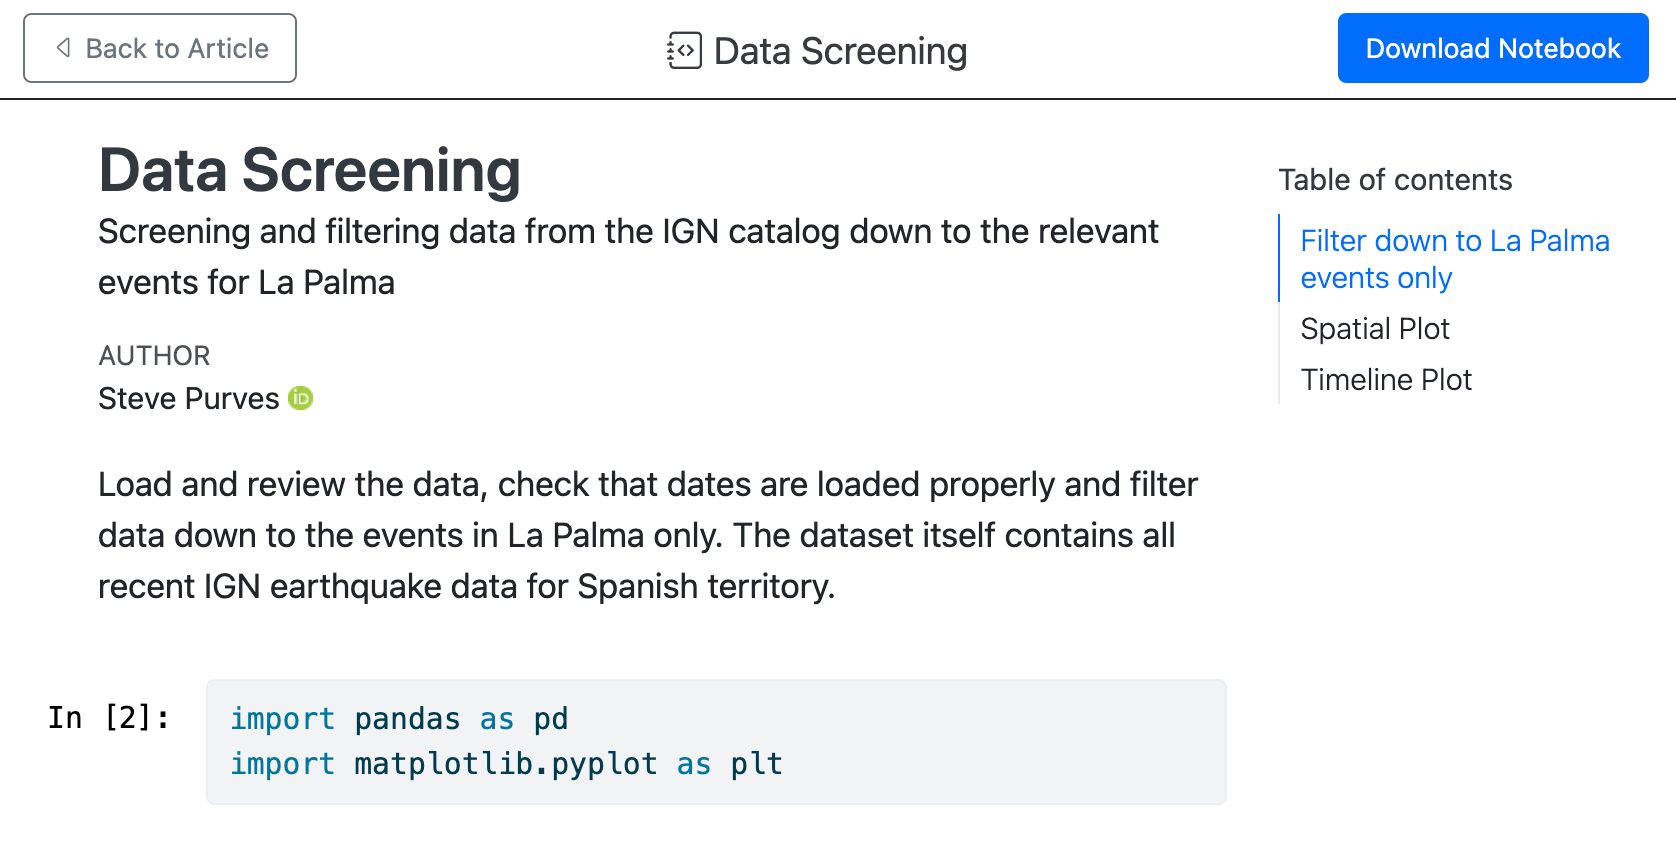
Quarto Manuscripts: Notebooks
Quarto dashboards

Quarto dashboards
---
title: "Development Indicators by Continent"
author: "Gapminder Analytics Group"
format: dashboard
---
```{python}
import plotly.express as px
df = px.data.gapminder()
```
## Row {height=60%}
```{python}
#| title: GDP and Life Expectancy
px.scatter(
df, x="gdpPercap", y="lifeExp",
animation_frame="year", animation_group="country",
size="pop", color="continent", hover_name="country",
facet_col="continent", log_x=True, size_max=45,
range_x=[100,100000], range_y=[25,90]
)
```
## Row {height=40%}
```{python}
#| title: Population
px.area(
df, x="year", y="pop",
color="continent", line_group="country"
)
```
```{python}
#| title: Life Expectancy
px.line(
df, x="year", y="lifeExp",
color="continent", line_group="country"
)
```- 1
-
The document options define the
titleandauthorfor the navigation bar as well as specifying the use of thedashboardformat. - 2
-
Rows and columns are defined using headings. In this example we define two rows and specify their relative sizes using the
heightoption. - 3
-
Computational cells become cards that live within rows or columns. Cards can have an optional title (which here we specify using the
titleoption). - 4
- The second row includes two computational cells, which are automatically split into two side by side cards.
Interactivity, Jupyter Widgets
Interactivity, Observable
Quarto also includes native support for Observable JS, a set of enhancements to vanilla JavaScript created by Mike Bostock (also the author of D3)
Interactivity, on the fly Observable “widgets”
Quarto including Observable means you can create new “widgets” or allow the user to modify portions of the doc on the fly.
Converting temperature from ℃ to ℉
Celsius = ℃ and Fahrenheit = ℉.
ShinyLive + Quarto = WASM
#| standalone: true
#| viewerHeight: 420
#| echo: false
#| eval: true

from shiny import App, render, ui
import numpy as np
import matplotlib.pyplot as plt

app_ui = ui.page_fluid(
    ui.layout_sidebar(
        ui.panel_sidebar(
            ui.input_slider("period", "Period", 0.5, 4, 1, step=0.5),
            ui.input_slider("amplitude", "Amplitude", 0, 2, 1, step=0.25),
            ui.input_slider("shift", "Phase shift", 0, 2, 0, step=0.1),
        ),
        ui.panel_main(
            ui.output_plot("plot"),
        ),
    ),
)


def server(input, output, session):
    @output
    @render.plot(alt="Sine wave")
    def plot():
        t = np.arange(0.0, 4.0, 0.01)
        s = input.amplitude() * np.sin(
            2 * np.pi / input.period() * (t - input.shift() / 2)
        )
        fig, ax = plt.subplots()
        ax.set_ylim([-2, 2])
        ax.plot(t, s)
        ax.grid()


app = App(app_ui, server)
ShinyLive + Quarto = WASM
No server needed, all in browser!
```{shinylive-python}
#| standalone: true
#| viewerHeight: 420

from shiny import App, render, ui
import numpy as np
import matplotlib.pyplot as plt

app_ui = ui.page_fluid(
    ui.layout_sidebar(
        ui.panel_sidebar(
            ui.input_slider("period", "Period", 0.5, 4, 1, step=0.5),
            ui.input_slider("amplitude", "Amplitude", 0, 2, 1, step=0.25),
            ui.input_slider("shift", "Phase shift", 0, 2, 0, step=0.1),
        ),
        ui.panel_main(
            ui.output_plot("plot"),
        ),
    ),
)


def server(input, output, session):
    @output
    @render.plot(alt="Sine wave")
    def plot():
        t = np.arange(0.0, 4.0, 0.01)
        s = input.amplitude() * np.sin(
            2 * np.pi / input.period() * (t - input.shift() / 2)
        )
        fig, ax = plt.subplots()
        ax.set_ylim([-2, 2])
        ax.plot(t, s)
        ax.grid()


app = App(app_ui, server)

```
Parameters - one source, many outputs
- Showing results for a specific geographic location.
- Running a report that covers a specific time period.
- Running a single analysis multiple times for different assumptions.
Rendering with parameters
To render using different parameters you can pass them on the command line using the -P flag:
Quarto Publish

Built-in vs custom
One goal of Quarto is to provide a markdown-centric format-agnostic syntax as shown in previous slides.
- Quarto bundles Bootstrap CSS and themes, and respects SASS variables for robust styling of HTML content (HTML documents, websites, books, slides, etc).
- Quarto includes LaTeX templates for specific journals as well as good defaults for PDF outputs in general.
- Quarto respects docx and pptx templates, again allowing for robust styling.
- You shouldn’t HAVE to escape out to writing raw LaTeX, HTML, Jinja templates, etc
- In vast majority of situations, can rely purely on Markdown syntax
- BUT you can always include raw content such as LaTeX, CSS, HTML, JavaScript to further customize and optimize for a specific format.
Extending Quarto with extensions
Quarto, crafted with love and care
Development of Quarto is sponsored by Posit, PBC (formerly known as RStudio, PBC). The same core team works on both Quarto and R Markdown:
Carlos Scheidegger (@cscheid)
Charles Teague (@dragonstyle)
Christophe Dervieux (@cderv)
J.J. Allaire (@jjallaire)
Here is the full contributors list. Quarto is open source and we welcome contributions in our github repository as well! https://github.com/quarto-dev/quarto-cli.
Quarto
- Batteries included, shared syntax across output types and languages
- Single source publishing across document types, with raw customization allowed
- Choose your own editor for plain text .qmd or Jupyter notebooks
- Quarto projects + freeze for managing stored computation
Follow @quarto_pub #QuartoPub on Twitter/Fosstodon to stay up to date!
Web resources
- Quarto.org for documentation or the Quarto FAQ
- Get Started with Quarto + Python

Quarto resources
General Quarto
Why the name “Quarto”?1


